はじめに
EC2(Linux)のシステム監視をCloudWatchから行うために必要な作業手順についてまとめてみます。
実際にシステム監視する場合は、プロセス監視等の独自カスタムメトリクスを作成することになると思いますので、参考としてプロセス監視の設定手順についても合わせて記載します。
事前作業
IAMロールの設定
監視対象とするEC2(Linux)にアタッチされたIAMロールにCloudWatchAgentServerPolicy(IAMポリシー)※をアタッチします。
※以下CloudWatch エージェントをインストールするから抜粋
また、インスタンスにアタッチされた IAM ロールに CloudWatchAgentServerPolicy がアタッチされていることを確認する必要もあります。
CloudWatch Agentのインストール
CloudWatch Agentのインストール方法はコマンドラインを使用する方法もありますが、今回はAWS Systems Manager を使用して CloudWatch エージェントをインストールするのやり方でインストールします。
※EC2(Linux)にアタッチされたIAMロールにAmazonSSMManagedInstanceCore(IAMポリシー)がアタッチされている必要があります
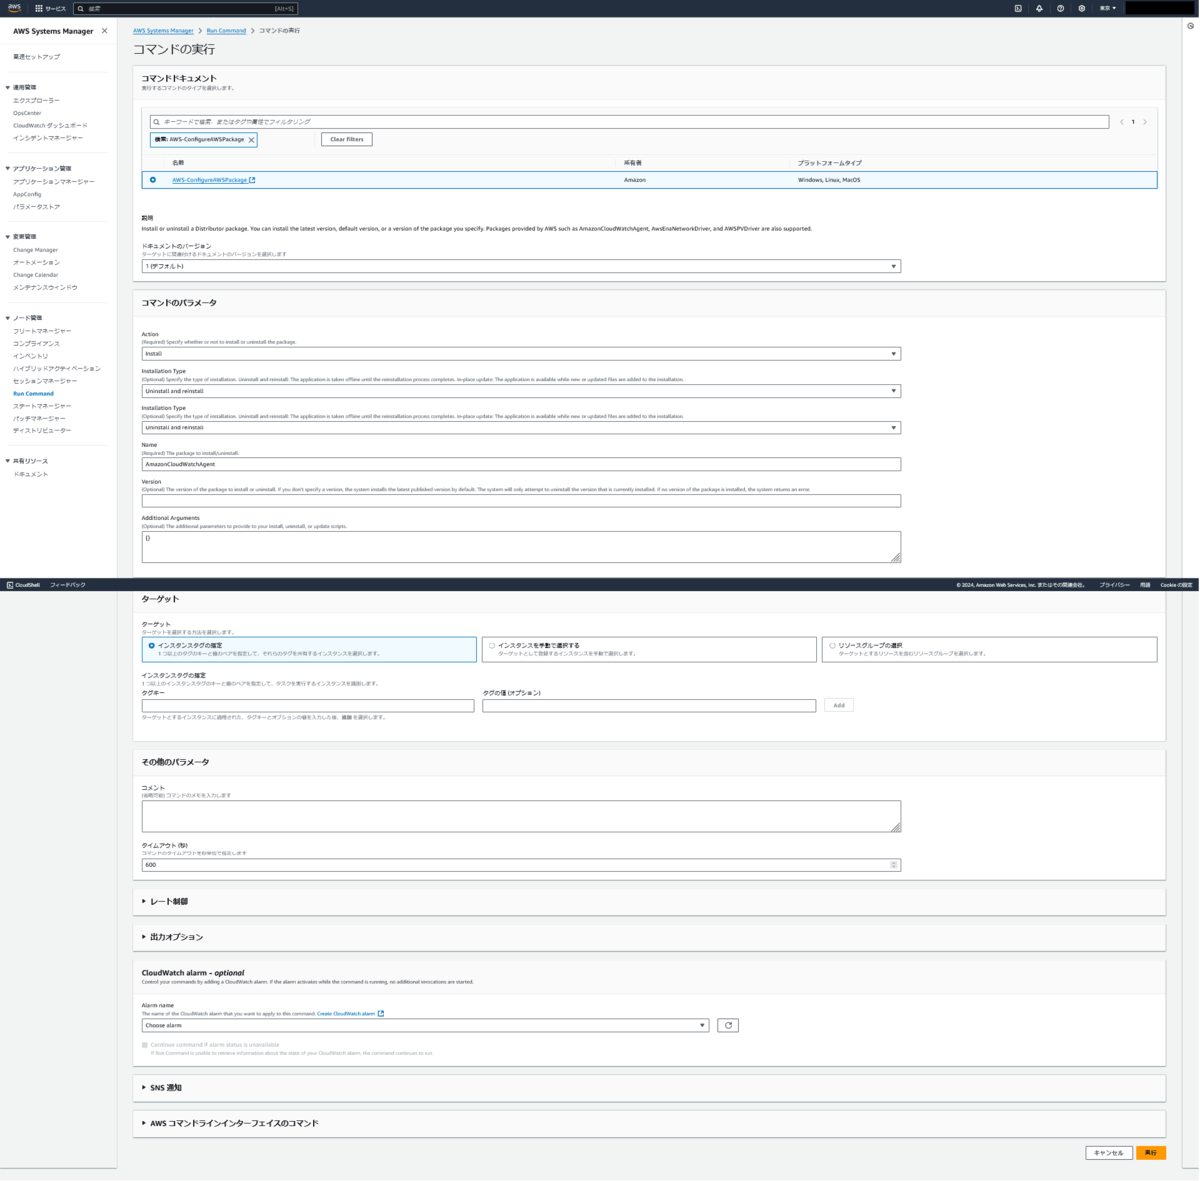
- AWSマネジメントコンソール上で
AWS Systems Manager > Run Command > コマンドの実行に遷移して、コマンドドキュメントリストで、AWS-ConfigureAWSPackageを選択します。 - [コマンドのパラメータ]の
NameボックスにAmazonCloudWatchAgentと入力します。 - ターゲットを指定します。※ご自身の環境に置き換えて指定してください
※その他項目については、必要に応じて指定してください
コマンドのステータスが成功であることを確認します。

OS起動時にamazon-cloudwatch-agentが自動起動するよう設定をします。
# systemctl enable amazon-cloudwatch-agent.service
カスタムメトリクスを監視対象に含める場合はcollectdのインストールも必要となるため、インストールされていない場合はcollectd を使用してカスタムメトリクスを取得するを参考にインストールを行ってください。
CloudWatch Agentの設定
ゼロからCloudWatch Agentの設定ファイルを作成するのは大変なのでウィザードを使用して CloudWatch エージェント設定ファイルを作成するを参考に初期設定ファイルを作成します。
# /opt/aws/amazon-cloudwatch-agent/bin/amazon-cloudwatch-agent-config-wizard
以下、実行結果になりますがご自身の利用環境に合わせてdefaultから変更してください。
================================================================
= Welcome to the Amazon CloudWatch Agent Configuration Manager =
=                                                              =
= CloudWatch Agent allows you to collect metrics and logs from =
= your host and send them to CloudWatch. Additional CloudWatch =
= charges may apply.                                           =
================================================================
On which OS are you planning to use the agent?
1. linux
2. windows
3. darwin
default choice: [1]:

Trying to fetch the default region based on ec2 metadata...
I! imds retry client will retry 1 timesAre you using EC2 or On-Premises hosts?
1. EC2
2. On-Premises
default choice: [1]:

Which user are you planning to run the agent?
1. cwagent
2. root
3. others
default choice: [1]:

Do you want to turn on StatsD daemon?
1. yes
2. no
default choice: [1]:

Which port do you want StatsD daemon to listen to?
default choice: [8125]

What is the collect interval for StatsD daemon?
1. 10s
2. 30s
3. 60s
default choice: [1]:

What is the aggregation interval for metrics collected by StatsD daemon?
1. Do not aggregate
2. 10s
3. 30s
4. 60s
default choice: [4]:

Do you want to monitor metrics from CollectD? WARNING: CollectD must be installed or the Agent will fail to start
1. yes
2. no
default choice: [1]:

Do you want to monitor any host metrics? e.g. CPU, memory, etc.
1. yes
2. no
default choice: [1]:

Do you want to monitor cpu metrics per core?
1. yes
2. no
default choice: [1]:

Do you want to add ec2 dimensions (ImageId, InstanceId, InstanceType, AutoScalingGroupName) into all of your metrics if the info is available?
1. yes
2. no
default choice: [1]:

Do you want to aggregate ec2 dimensions (InstanceId)?
1. yes
2. no
default choice: [1]:

Would you like to collect your metrics at high resolution (sub-minute resolution)? This enables sub-minute resolution for all metrics, but you can customize for specific metrics in the output json file.
1. 1s
2. 10s
3. 30s
4. 60s
default choice: [4]:

Which default metrics config do you want?
1. Basic
2. Standard
3. Advanced
4. None
default choice: [1]:

Current config as follows:
{
        "agent": {
                "metrics_collection_interval": 60,
                "run_as_user": "cwagent"
        },
        "metrics": {
                "aggregation_dimensions": [
                        [
                                "InstanceId"
                        ]
                ],
                "append_dimensions": {
                        "AutoScalingGroupName": "${aws:AutoScalingGroupName}",
                        "ImageId": "${aws:ImageId}",
                        "InstanceId": "${aws:InstanceId}",
                        "InstanceType": "${aws:InstanceType}"
                },
                "metrics_collected": {
                        "collectd": {
                                "metrics_aggregation_interval": 60
                        },
                        "disk": {
                                "measurement": [
                                        "used_percent"
                                ],
                                "metrics_collection_interval": 60,
                                "resources": [
                                        "*"
                                ]
                        },
                        "mem": {
                                "measurement": [
                                        "mem_used_percent"
                                ],
                                "metrics_collection_interval": 60
                        },
                        "statsd": {
                                "metrics_aggregation_interval": 60,
                                "metrics_collection_interval": 10,
                                "service_address": ":8125"
                        }
                }
        }
}
Are you satisfied with the above config? Note: it can be manually customized after the wizard completes to add additional items.
1. yes
2. no
default choice: [1]:

Do you have any existing CloudWatch Log Agent (http://docs.aws.amazon.com/AmazonCloudWatch/latest/logs/AgentReference.html) configuration file to import for migration?
1. yes
2. no
default choice: [2]:

Do you want to monitor any log files?
1. yes
2. no
default choice: [1]:
2
Do you want the CloudWatch agent to also retrieve X-ray traces?
1. yes
2. no
default choice: [1]:
2
Existing config JSON identified and copied to:  /opt/aws/amazon-cloudwatch-agent/etc/backup-configs
Saved config file to /opt/aws/amazon-cloudwatch-agent/bin/config.json successfully.
Current config as follows:
{
        "agent": {
                "metrics_collection_interval": 60,
                "run_as_user": "cwagent"
        },
        "metrics": {
                "aggregation_dimensions": [
                        [
                                "InstanceId"
                        ]
                ],
                "append_dimensions": {
                        "AutoScalingGroupName": "${aws:AutoScalingGroupName}",
                        "ImageId": "${aws:ImageId}",
                        "InstanceId": "${aws:InstanceId}",
                        "InstanceType": "${aws:InstanceType}"
                },
                "metrics_collected": {
                        "collectd": {
                                "metrics_aggregation_interval": 60
                        },
                        "disk": {
                                "measurement": [
                                        "used_percent"
                                ],
                                "metrics_collection_interval": 60,
                                "resources": [
                                        "*"
                                ]
                        },
                        "mem": {
                                "measurement": [
                                        "mem_used_percent"
                                ],
                                "metrics_collection_interval": 60
                        },
                        "statsd": {
                                "metrics_aggregation_interval": 60,
                                "metrics_collection_interval": 10,
                                "service_address": ":8125"
                        }
                }
        }
}
Please check the above content of the config.
The config file is also located at /opt/aws/amazon-cloudwatch-agent/bin/config.json.
Edit it manually if needed.
Do you want to store the config in the SSM parameter store?
1. yes
2. no
default choice: [1]:
2
Program exits now.
上記手順で作成された設定ファイルを移動・配置します。
# mv /opt/aws/amazon-cloudwatch-agent/bin/config.json /opt/aws/amazon-cloudwatch-agent/etc/amazon-cloudwatch-agent.json
次にamazon-cloudwatch-agent.jsonへプロセス監視の設定を追加します。
※procstat プラグインでプロセスメトリクスを収集するを参考
最後のprocstatがプロセス監視設定の追加箇所になります。
{
    "agent": {
            "metrics_collection_interval": 60,
            "run_as_user": "cwagent"
    },
    "metrics": {
            "aggregation_dimensions": [
                    [
                            "InstanceId"
                    ]
            ],
            "append_dimensions": {
                    "InstanceId": "${aws:InstanceId}"
            },
            "metrics_collected": {
                    "collectd": {
                            "metrics_aggregation_interval": 60
                    },
                    "disk": {
                            "measurement": [
                                    "used_percent"
                            ],
                            "metrics_collection_interval": 60,
                            "resources": [
                                    "/"                            ]
                    },
                    "mem": {
                            "measurement": [
                                    "mem_used_percent"
                            ],
                            "metrics_collection_interval": 60
                    },
                    "statsd": {
                            "metrics_aggregation_interval": 60,
                            "metrics_collection_interval": 10,
                            "service_address": ":8125"
                    },
                    "procstat": [
                        {
                            "pattern": "chronyd",
                            "measurement": [
                                "pid_count"
                             ],
                            "metrics_collection_interval": 60
                         },
                        {
                            "pattern": "crond",
                            "measurement": [
                                "pid_count"
                             ],
                            "metrics_collection_interval": 60
                         },
                        {
                            "pattern": "rsyslogd",
                            "measurement": [
                                "pid_count"
                             ],
                            "metrics_collection_interval": 60
                         }
                    ]
            }
        }
}
また、ここではプロセス監視設定以外に、メトリクスのディメンションとディスク監視についても修正しています。
metrics.append_dimensions:ディメンジョンとしてインスタンスIDを指定して、メトリクスを確認する単位をインスタンス単位にする。
metrics.metrics_collected.disk.resources:/(ルート)パーティションのディスク使用率の設定例として記載
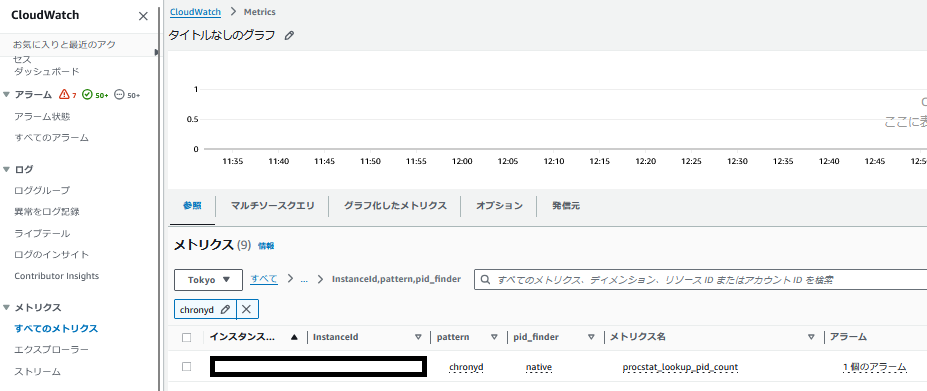
カスタムメトリクスの確認
AWSマネジメントコンソール上でCloudWatch > Metricsへ遷移し、カスタム名前空間CWAgent > InstanceId,pattern,pid_finderを参照してカスタムメトリクスが作成されていることを確認します。
CloudWatch アラームの設定
プロセスが落ちている際にメールを通知するよう、CloudWatchアラームの設定をおこないます。
※以下例としてchronydプロセスの場合
aws cloudwatch put-metric-alarm \
--alarm-name 'AWS/EC2 proc chronyd Name=<サーバー名>' \
--actions-enabled \
--ok-actions 'arn:aws:sns:ap-northeast-1:<AWSアカウント番号>:<SNSトピック名>' \
--alarm-actions 'arn:aws:sns:ap-northeast-1:<AWSアカウント番号>:<SNSトピック名>' \
--metric-name 'procstat_lookup_pid_count' \
--namespace 'CWAgent' \
--statistic 'Minimum' \
--dimensions '[{"Name":"InstanceId","Value":"<インスタンスID>"},{"Name":"pattern","Value":"chronyd"},{"Name":"pid_finder","Value":"native"}]' \
--period 300 \
--evaluation-periods 1 \
--datapoints-to-alarm 1 \
--threshold 1 \
--comparison-operator 'LessThanThreshold' \
--treat-missing-data 'missing'
おわりに
CloudWatch Agentの初期設定からプロセス監視までの設定方法についてご紹介しました。
AWS環境で手軽にシステム監視を行う方法としてご参考になればと思います。
