
2023/09/25 追記: 自分でガントチャートの開始日、終了日を設定できるバージョンの書式設定 も作成してみました。こちらも参考にしてみてください。
上図のような年間ガントチャートを表示する書式設定を作成してみました。
列の書式設定でスケジュール表示したほうが使い勝手いいかも! #SharePoint #MicrosoftLists #ListFormatting pic.twitter.com/gRKsHx9myl
— てっちゃん (Tetsuya Kawahara) (@techan_k) 2021年4月10日
以下、作成方法を記載します。
フィールド定義
リストを作成し、次のフィールドを定義します。
| 列の内部名 | 列の種類 |
|---|---|
| Title | 1行テキスト |
| Start | 日付 |
| End | 日付 |
| Year(※何でもOK) | 集計値(数値) |
| Schedule(※何でもOK) | 1行テキスト(※何でもOK) |

[Year] 列の数式には、次の式を設定します。
=TEXT(Start,"yyyy")

ビューの設定
年度ごとにスケジュールが表示されるようにするため、[Year] 列でグループ化します。
列ヘッダーの [Year] をクリック > [Year でグループ化] をクリックします。

列の書式設定(ガントチャートの表示)
ガントチャートを表示するために、列の書式設定をします。
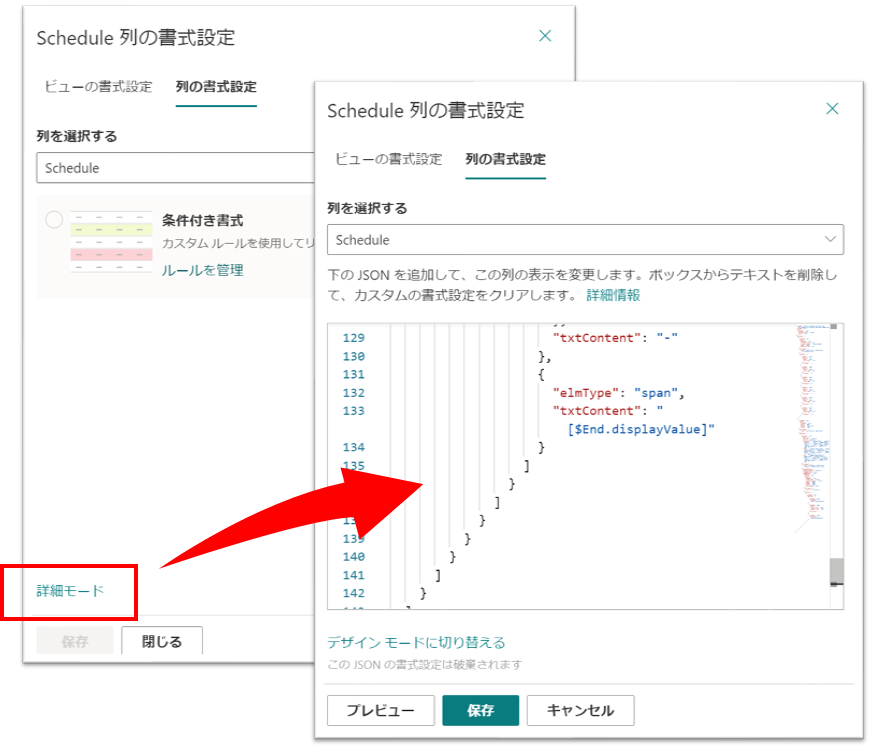
列ヘッダーの [Shedule] をクリック > [列の設定] > [この列の書式設定] をクリックします。

画面右側に書式設定の画面が表示されるので、[詳細モード] をクリックし、次の JSON をテキストボックスにコピー & ペーストします。
{
  "$schema": "https://developer.microsoft.com/json-schemas/sp/v2/column-formatting.schema.json",
  "elmType": "div",
  "style": {
    "display": "flex",
    "flex-direction": "column",
    "margin": "5px"
  },
  "children": [
    {
      "elmType": "div",
      "style": {
        "display": "flex",
        "flex-direction": "row",
        "justify-content": "space-between",
        "width": "100%",
        "margin-bottom": "3px"
      },
      "attributes": {
        "class": "ms-fontColor-themePrimary ms-fontWeight-bold"
      },
      "children": [
        {
          "elmType": "span",
          "style": {
            "width": "100%",
            "text-align": "left"
          },
          "txtContent": "1"
        },
        {
          "elmType": "span",
          "style": {
            "width": "100%",
            "text-align": "left"
          },
          "txtContent": "3"
        },
        {
          "elmType": "span",
          "style": {
            "width": "100%",
            "text-align": "left"
          },
          "txtContent": "5"
        },
        {
          "elmType": "span",
          "style": {
            "width": "100%",
            "text-align": "left"
          },
          "txtContent": "7"
        },
        {
          "elmType": "span",
          "style": {
            "width": "100%",
            "text-align": "left"
          },
          "txtContent": "9"
        },
        {
          "elmType": "span",
          "style": {
            "width": "100%",
            "text-align": "left"
          },
          "txtContent": "11"
        }
      ]
    },
    {
      "elmType": "div",
      "style": {
        "display": "flex",
        "width": "100%",
        "border": "2px solid",
        "height": "20px"
      },
      "attributes": {
        "class": "ms-fontColor-themePrimary"
      },
      "children": [
        {
          "elmType": "div",
          "style": {
            "position": "relative",
            "cursor": "pointer",
            "max-width": "=((Number(Date('' + getYear([$Start]) + '/12/31')) - Number(Date([$Start]))) / (Number(Date('' + getYear([$Start]) + '/12/31')) - Number(Date('' + getYear([$Start]) + '/01/01')))) * 100 + '%'",
            "width": "=((Number(Date([$End])) - Number(Date([$Start]))) / (Number(Date('' + getYear([$Start]) + '/12/31')) - Number(Date('' + getYear([$Start]) + '/01/01')))) * 100 + '%'",
            "left": "=((Number(Date([$Start])) - Number(Date('' + getYear([$Start]) + '/01/01'))) / (Number(Date('' + getYear([$Start]) + '/12/31')) - Number(Date('' + getYear([$Start]) + '/01/01')))) * 100 + '%'"
          },
          "attributes": {
            "class": "ms-bgColor-themePrimary ms-bgColor-themeTertiary--hover"
          },
          "customCardProps": {
            "directionalHint": "topCenter",
            "isBeakVisible": true,
            "openOnEvent": "hover",
            "formatter": {
              "elmType": "div",
              "style": {
                "display": "flex",
                "align-items": "center",
                "justify-content": "center",
                "width": "250px",
                "height": "30px",
                "margin": "10px",
                "font-weight": "bold"
              },
              "attributes": {
                "class": "ms-fontSize-l"
              },
              "children": [
                {
                  "elmType": "div",
                  "children": [
                    {
                      "elmType": "span",
                      "txtContent": "[$Start.displayValue]"
                    },
                    {
                      "elmType": "span",
                      "style": {
                        "margin-left": "5px",
                        "margin-right": "5px"
                      },
                      "txtContent": "-"
                    },
                    {
                      "elmType": "span",
                      "txtContent": "[$End.displayValue]"
                    }
                  ]
                }
              ]
            }
          }
        }
      ]
    }
  ]
}
[保存] をクリックすると、[Schedule] 列にガントチャートが表示されます。

ガントチャートは列幅にあわせて大きさが変わるようになっています。
下図のように、マウスで列幅を調整ください。
列幅調整後、ビューの変更情報(列幅を変更した情報)を保存ください。
変更情報を保存しなければ、リストを開き直したときに、列幅が調整前の列幅で表示されてしまいます。

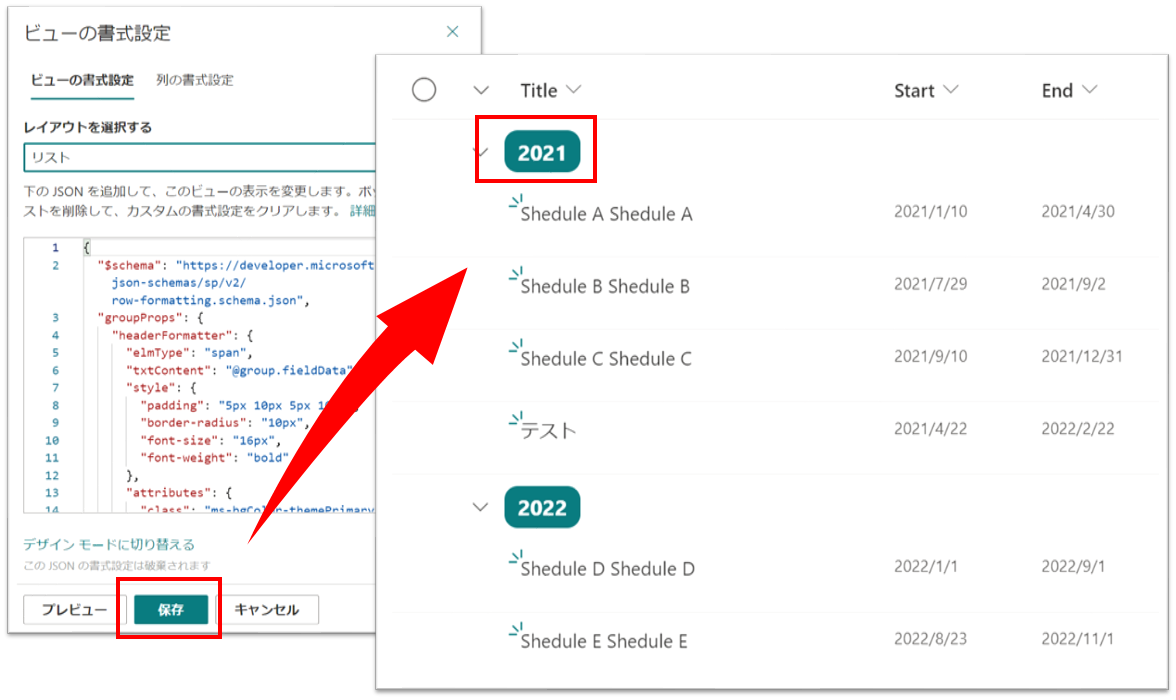
ビューの書式設定(グループヘッダーの見た目変更)
グループヘッダーの年度を色付けしたい場合は、次からの手順を実施してください。

ビュー名をクリックし、[現在のビューの書式設定] をクリックします。
画面右側に書式設定の画面が表示されるので、次の JSON をテキストボックスにコピー & ペーストします。

{
  "$schema": "https://developer.microsoft.com/json-schemas/sp/v2/row-formatting.schema.json",
  "groupProps": {
    "headerFormatter": {
      "elmType": "span",
      "txtContent": "@group.fieldData",
      "style": {
        "padding": "5px 10px 5px 10px",
        "border-radius": "10px",
        "font-size": "16px",
        "font-weight": "bold"
      },
      "attributes": {
        "class": "ms-bgColor-themePrimary ms-fontColor-white"
      }
    }
  }
}
設定後、[保存] をクリックすると、グループヘッダーの年度の見た目が変わります。
ビューの書式設定(グループヘッダーに月度表示)
下図のように、グループヘッダーに月度を表示したい場合は、次からの手順を実施してください。
※注意:このカスタマイズを適用した場合、ガントチャートの大きさは固定です。

ビュー名をクリックし、[現在のビューの書式設定] をクリックします。
画面右側に書式設定の画面が表示されるので、次の JSON をテキストボックスにコピー & ペーストします。
{
  "$schema": "https://developer.microsoft.com/json-schemas/sp/v2/row-formatting.schema.json",
  "hideColumnHeader": true,
  "hideSelection": true,
  "rowFormatter": {
    "elmType": "div",
    "style": {
      "display": "flex",
      "flex-direction": "row"
    },
    "children": [
      {
        "elmType": "div",
        "style": {
          "position": "relative",
          "display": "flex",
          "width": "383px",
          "align-items": "center",
          "font-size": "15px",
          "height": "35px",
          "margin-top": "5px",
          "margin-bottom": "5px"
        },
        "children": [
          {
            "elmType": "span",
            "style": {
              "position": "relative",
              "display": "flex",
              "height": "100%",
              "align-items": "center",
              "left": "110px"
            },
            "txtContent": "[$Title]"
          }
        ]
      },
      {
        "elmType": "div",
        "style": {
          "display": "flex",
          "width": "700px",
          "border": "2px solid",
          "height": "25px"
        },
        "attributes": {
          "class": "ms-fontColor-themePrimary"
        },
        "children": [
          {
            "elmType": "div",
            "style": {
              "position": "relative",
              "cursor": "pointer",
              "max-width": "=((Number(Date('' + getYear([$Start]) + '/12/31')) - Number(Date([$Start]))) / (Number(Date('' + getYear([$Start]) + '/12/31')) - Number(Date('' + getYear([$Start]) + '/01/01')))) * 100 + '%'",
              "width": "=((Number(Date([$End])) - Number(Date([$Start]))) / (Number(Date('' + [$Year] + '/12/31')) - Number(Date('' + [$Year] + '/01/01')))) * 100 + '%'",
              "left": "=((Number(Date([$Start])) - Number(Date('' + [$Year] + '/01/01'))) / (Number(Date('' + [$Year] + '/12/31')) - Number(Date('' + [$Year] + '/01/01')))) * 100 + '%'"
            },
            "attributes": {
              "class": "ms-bgColor-themePrimary ms-bgColor-themeLight--hover"
            },
            "customCardProps": {
              "directionalHint": "topCenter",
              "isBeakVisible": true,
              "openOnEvent": "hover",
              "formatter": {
                "elmType": "div",
                "style": {
                  "display": "flex",
                  "align-items": "center",
                  "justify-content": "center",
                  "width": "250px",
                  "height": "30px",
                  "margin": "10px",
                  "font-weight": "bold"
                },
                "attributes": {
                  "class": "ms-fontSize-l"
                },
                "children": [
                  {
                    "elmType": "div",
                    "children": [
                      {
                        "elmType": "span",
                        "txtContent": "[$Start.displayValue]"
                      },
                      {
                        "elmType": "span",
                        "style": {
                          "margin-left": "5px",
                          "margin-right": "5px"
                        },
                        "txtContent": "-"
                      },
                      {
                        "elmType": "span",
                        "txtContent": "[$End.displayValue]"
                      }
                    ]
                  }
                ]
              }
            }
          }
        ]
      }
    ]
  },
  "groupProps": {
    "headerFormatter": {
      "elmType": "div",
      "style": {
        "display": "flex",
        "flex-direction": "row"
      },
      "children": [
        {
          "elmType": "div",
          "style": {
            "width": "300px"
          },
          "children": [
            {
              "elmType": "span",
              "txtContent": "@group.fieldData",
              "style": {
                "padding": "5px 10px 5px 10px",
                "border-radius": "10px",
                "font-size": "16px",
                "font-weight": "bold"
              },
              "attributes": {
                "class": "ms-bgColor-themePrimary ms-fontColor-white"
              }
            }
          ]
        },
        {
          "elmType": "div",
          "style": {
            "display": "flex",
            "flex-direction": "row",
            "justify-content": "space-between",
            "width": "700px",
            "border": "2px solid",
            "height": "32px",
            "font-weight": "bold",
            "font-size": "18px"
          },
          "attributes": {
            "class": "ms-fontColor-themePrimary"
          },
          "children": [
            {
              "elmType": "span",
              "style": {
                "width": "100%",
                "display": "flex",
                "justify-content": "center",
                "align-items": "center"
              },
              "txtContent": "1"
            },
            {
              "elmType": "span",
              "style": {
                "width": "100%",
                "display": "flex",
                "justify-content": "center",
                "align-items": "center"
              },
              "txtContent": "2"
            },
            {
              "elmType": "span",
              "style": {
                "width": "100%",
                "display": "flex",
                "justify-content": "center",
                "align-items": "center"
              },
              "txtContent": "3"
            },
            {
              "elmType": "span",
              "style": {
                "width": "100%",
                "display": "flex",
                "justify-content": "center",
                "align-items": "center"
              },
              "txtContent": "4"
            },
            {
              "elmType": "span",
              "style": {
                "width": "100%",
                "display": "flex",
                "justify-content": "center",
                "align-items": "center"
              },
              "txtContent": "5"
            },
            {
              "elmType": "span",
              "style": {
                "width": "100%",
                "display": "flex",
                "justify-content": "center",
                "align-items": "center"
              },
              "txtContent": "6"
            },
            {
              "elmType": "span",
              "style": {
                "width": "100%",
                "display": "flex",
                "justify-content": "center",
                "align-items": "center"
              },
              "txtContent": "7"
            },
            {
              "elmType": "span",
              "style": {
                "width": "100%",
                "display": "flex",
                "justify-content": "center",
                "align-items": "center"
              },
              "txtContent": "8"
            },
            {
              "elmType": "span",
              "style": {
                "width": "100%",
                "display": "flex",
                "justify-content": "center",
                "align-items": "center"
              },
              "txtContent": "9"
            },
            {
              "elmType": "span",
              "style": {
                "width": "100%",
                "display": "flex",
                "justify-content": "center",
                "align-items": "center"
              },
              "txtContent": "10"
            },
            {
              "elmType": "span",
              "style": {
                "width": "100%",
                "display": "flex",
                "justify-content": "center",
                "align-items": "center"
              },
              "txtContent": "11"
            },
            {
              "elmType": "span",
              "style": {
                "width": "100%",
                "display": "flex",
                "justify-content": "center",
                "align-items": "center"
              },
              "txtContent": "12"
            }
          ]
        }
      ]
    }
  }
}
設定後、[保存] をクリックすると、グループヘッダーに月度が表示されます。

年間スケジュール📆 #SharePoint #MicrosoftLists #ListFormatting pic.twitter.com/omFOK6iaRL
— てっちゃん (Tetsuya Kawahara) (@techan_k) 2021年4月10日
以上、年間ガントチャートを作成する方法でした。
