ADAPTにおけるプロット機能の更新情報である。
プロット機能の詳細はこちらへ。
GitHubリポジトリはこちらへ。
ラベルプロット機能の追加
PlotLabels関数を用意した。指定した座標に文字列を表示する機能である。ラベルはstd::stringや数値型のrangesであればよい。色、回転、フォント、オフセットなどの指定が可能だが、可変サイズはgnuplotの変な仕様のためにちょっと特殊な指定方法が必要になる。
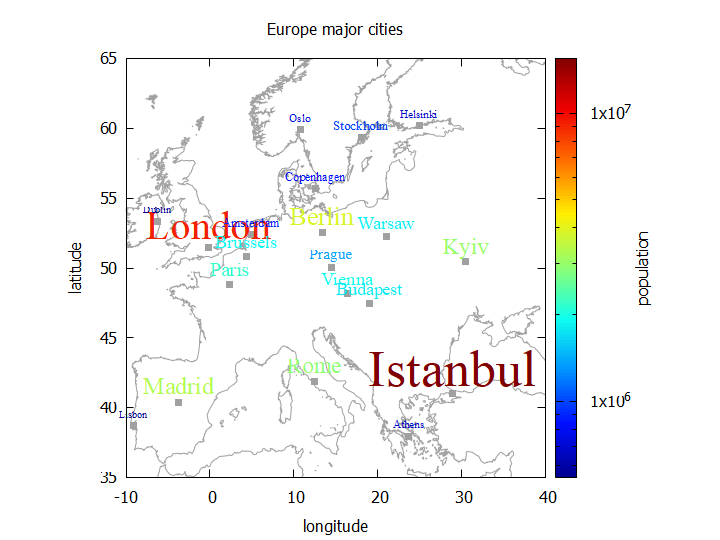
    std::vector<std::string> cities = { "London", "Paris", "Berlin", "Rome", "Madrid", "Amsterdam", "Brussels", "Vienna", "Prague", "Warsaw", "Budapest", "Stockholm", "Copenhagen", "Helsinki", "Oslo", "Dublin", "Lisbon", "Athens", "Istanbul", "Kyiv" };
    std::vector<double> latitudes = { 51.5074, 48.8566, 52.5200, 41.9028, 40.4168, 52.3676, 50.8503, 48.2082, 50.0755, 52.2298, 47.4979, 59.3293, 55.6761, 60.1695, 59.9139, 53.3498, 38.7169, 37.9838, 41.0082, 50.4501 };
    std::vector<double> longitudes = { -0.1278, 2.3522, 13.4050, 12.4964, -3.7038, 4.9041, 4.3517, 16.3738, 14.4378, 21.0122, 19.0402, 18.0686, 12.5683, 24.9354, 10.7522, -6.2603, -9.1399, 23.7275, 28.9784, 30.5234 };
    std::vector<int> populations = { 8982000, 2148000, 3769000, 2873000, 3266000, 872680, 1867000, 1921000, 1335000, 1794000, 1756000, 975551, 805402, 658864, 702543, 554554, 544851, 664046, 15462452, 2963199 };

    //If you want to plot labels with different sizes, label strings should be formatted as "{/=fontsize label}".
    auto dscities = adapt::views::Zip(cities, populations) |
        std::views::transform([](const auto& x) { return std::format("\"{{/={} {}}}\"", std::sqrt(std::get<1>(x) / 10000), std::get<0>(x)); });

    namespace plot = adapt::plot;
    adapt::Canvas2D g(output_filename);
    g.EnableInMemoryDataTransfer(enable_in_memory_data_transfer);
    g.SetXRange(-10, 40);
    g.SetYRange(35, 65);
    g.SetSizeRatio(1);
    g.SetXLabel("longitude");
    g.SetYLabel("latitude");
    g.SetCBLabel("population");
    g.SetLogCB();
    g.SetTitle("Europe major cities");
    // world_10m.txt can be downloaded from https://gnuplotting.org/plotting-the-world-revisited/
    g.PlotPoints("PlotExamples/world_10m.txt", "1", "2", plot::notitle, plot::c_dark_gray, plot::s_lines).
        PlotPoints(longitudes, latitudes, plot::notitle, plot::pt_fbox, plot::c_dark_gray).
        //PlotLabels(longitudes, latitudes, cities, plot::variable_color = populations,
        //          plot::labelfont = "Times New Roman,12", plot::lp_center, plot::notitle, plot::labeloffset = {0.0, 0.7});// labels with the same size
        PlotLabels(longitudes, latitudes, dscities, plot::variable_color = populations,
                   plot::labelfont = "Times New Roman", plot::lp_center, plot::notitle, plot::labeloffset = { 0.0, 0.7 });// labels with different sizes
std::vector<int> x;
std::vector<int> y;
std::vector<int> label;
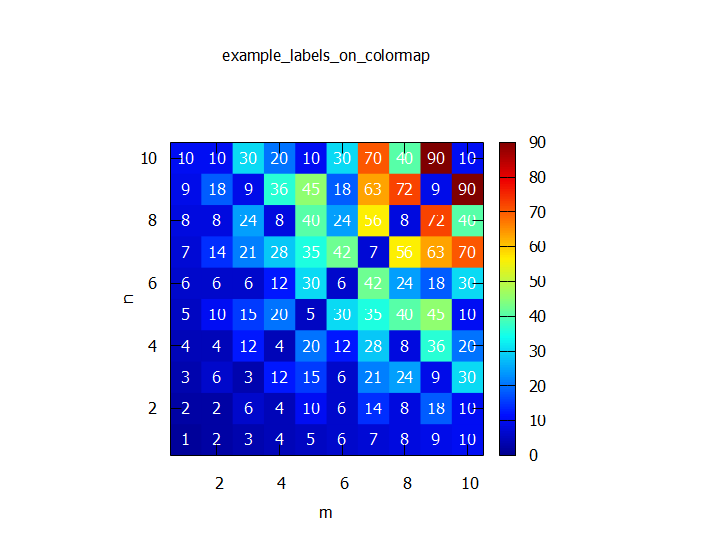
adapt::Matrix<double> m(10, 10);
for (int i = 1; i <= 10; ++i)
{
for (int j = 1; j <= 10; ++j)
{
int lcm = std::lcm(i, j);
m[i - 1][j - 1] = lcm;
x.push_back(i);
y.push_back(j);
label.push_back(lcm);
}
}
namespace plot = adapt::plot;
adapt::Canvas2D g(output_filename);// 以前はCanvasCMを使っていたが、2025/3/23の更新でCanvasCMは廃止、Canvas2Dに統合された。
g.SetTitle("example\\_labels\\_on\\_colormap");
g.SetXLabel("m");
g.SetYLabel("n");
g.SetSizeRatio(1);
g.SetXRange(0.5, 10.5);
g.SetYRange(0.5, 10.5);
g.PlotColormap(m, { 1, 10 }, { 1, 10 }, plot::notitle).
PlotLabels(x, y, label, plot::notitle, plot::lp_center, plot::c_white);
ヒストグラムのプロット機能の追加
従来ヒストグラムを描こうとすると自前でビンごとの数を計算する必要があったが、そのあたりを勝手にやってくれるPlotHistogramを用意した。ビンの左端、右端の座標、数を指定する必要がある。plot::he_poissonやplot::he_normalを与えるとビンごとに統計誤差を求めてエラーバーを表示する。統計誤差は前者だとポアソン信頼区間、後者は単純な平方根で算出、付与される。he_poissonなどを与えた場合はgnuplotにおけるxyerrorbars、与えなければhistepsで描画される。その他の仕様はPlotPoints関数に準ずる。
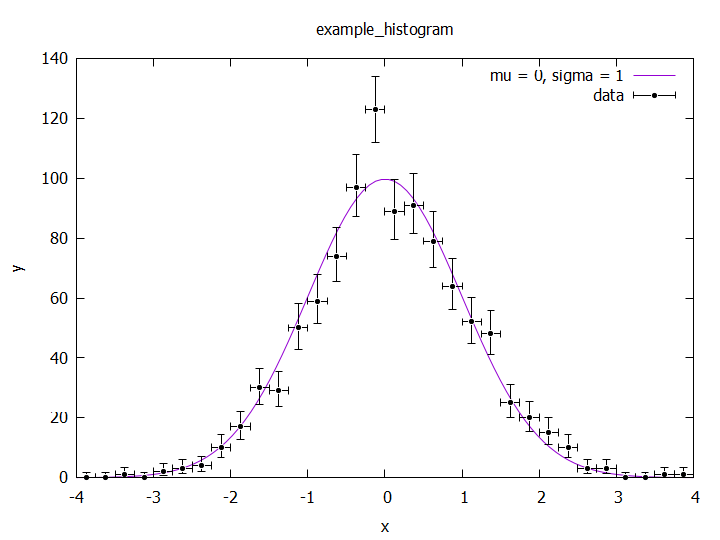
    std::string norm = std::to_string(250. / std::sqrt(2 * 3.1415926535));
    std::string equation = norm + "*exp(-x*x/2)";

    std::mt19937_64 mt(0);
    std::normal_distribution<> nd(0., 1.);
    std::vector<double> data;
    for (int i = 0; i < 1000; ++i)
    {
        double x = nd(mt);
        if (x < -4.0 || x >= 4.0) continue;
        data.push_back(x);
    }

    namespace plot = adapt::plot;
    adapt::Canvas2D g("output_filename.png");
    //g.ShowCommands(true);
    g.SetTitle("example\\_histogram");
    g.SetXRange(-4.0, 4.0);
    g.SetXLabel("x");
    g.SetYLabel("y");
    g.PlotPoints(equation, plot::title = "mu = 0, sigma = 1",
                 plot::s_lines).
        PlotHistogram(data, -4, 4, 32, plot::he_poisson,
                      plot::title = "data", plot::c_black, plot::pt_fcir, plot::ps_med_small, plot::lw_med_thick);
その他
大幅な設計変更を行った。用意していたが結局無駄になった拡張性などを削除し、C++20のコンセプトを中心とする形に変えた。特にこのあたりの記事で書いた動的ジェネリクスに関するコードを丸ごと処分したことで、それなりにスッキリとはしたと思う。
またgnuplotの不具合なのか、フォントをArialにした場合に文字の一部が切れてしまう問題が発生していたので、フォントをsansに戻した。sansであってもフォント切れは起こるが、Arialよりは幾分マシだった。いずれはフォントの詳細設定などもできるようにしたいが、ターミナルごとに設定方法が細かく異なり統一的なインターフェイスを設けることが難しいため未実装である。
今後
今回実装したヒストグラムは一次元だが、二次元ヒストグラムも頻繁に使うので遠からず実装する。いわゆるbinscatterのようなものになるだろう。
gnuplotでカラーマップを作る場合、昔はpm3dとset view mapを組み合わせるのが定番だったが、最近はそれ以外の方法も出てきているようで、遠からずそちらに変更したいと思っている。pm3dは処理が2Dの場合と異なり色々特殊なためにCanvas2DとCanvasCMにクラスを分ける必要があったのだが、これを統合したい。
現状Canvas3Dを作る予定はないが、仮にCanvasCMが消滅した場合、Canvas2Dという名前が宙ぶらりんで珍妙なことになってしまうのが若干の悩みどころ。いや別に、set view mapを消せば実質3Dで動作するはずではあるので、名前だけCMから3Dに変更して残しておいてもいいとは思うのだが。
というわけで、喫緊の機能を実装したのでしばしOpenADAPT本体のメンテナンスに戻りたい。あちらのsimd機能がまだビルドすら通らない状態で放置されている。
