前回の続きになります。
前回は autoscaler のコアサーバを起動し、cliからサーバの台数を増減させる水平スケールを試しました。今回はさくらのクラウドに備わるアクティビティグラフの情報を使い、自動でスケールアウト・インを行うオートスケールを試します。
設定
2022/3/4 追記
autoscaler v0.5.0 からコマンド体系および、設定が変更になっています。 以下のgistに動作確認した設定ファイルを置いています
autoscalerのインストールおよび基本的な設定は前回の記事を参考にしてください。 autoscaler_coreの設定は以下のようにしました。
resources:
  - type: ELB
    name: "hscale-elb"
    selector:
      names: ["tk-elb"]
    resources:
      - type: ServerGroup
        name: "hscale-group" #サーバのプリフィックスにもなります
        zone: "tk1b"

        min_size: 2
        max_size: 5

        shutdown_force: false

        plans:
          - name: smallest
            size: 2
          - name: medium
            size: 3
          - name: largest
            size: 5

        template:
          # tags: [ "tag1", "tag2" ]
          description: "hscale-group"
          interface_driver: "virtio"
          plan:
            core: 1
            memory: 1
            dedicated_cpu: false

          network_interfaces:
            - upstream: "shared" # 共有セグメント
              expose:
                ports: [80] #エンハンスドLBで使われるport番号
                server_group_name: "gr1" #エンハンスドLBで使われるグループ名


          disks:
            - os_type: "almalinux"
              plan: "ssd"
              connection: "virtio"
              size: 20

          edit_parameter:
            disabled: false
            password: ""
            disable_pw_auth: true
            enable_dhcp: false
            change_partition_uuid: true
            ssh_keys:
              - "ssh-ed25519  **********"

            startup_scripts:
              - |
                #!/bin/bash
                sudo yum install -y nginx
                sudo systemctl enable nginx
                echo -e "keepalive_requests 10;\ngzip_proxied any;\ngzip on;\ngzip_http_version 1.0;\ngzip_comp_level 9;\ngzip_types text/html;" > /etc/nginx/conf.d/gzip.conf
                curl https://ja.wikipedia.org/wiki/%E4%B8%96%E7%95%8C%E9%81%BA%E7%94%A3 > /usr/share/nginx/html/sekai.html
                sudo systemctl start nginx
                echo "server name: {{ .Name }}" >  /usr/share/nginx/html/index.html
                echo "OK" > /usr/share/nginx/html/live
                firewall-cmd --permanent --add-service http
                firewall-cmd --reload

# オートスケーラーの動作設定
autoscaler:
  cooldown: 540 # ジョブの連続実行を抑止するためのクールダウン期間を秒数で指定。デフォルト: 600(10分)
ほぼ同じですが、nginxに負荷をかけるため大きめのHTMLとgzipの設定を追加しています。
アクティビティグラフの情報取得
アクティビティグラフは、コントールパネルにも表示されています。5分ごとにCPUやトラフィック情報を収集し、表示しています。データはAPIでも取得可能です。

アクティビティグラフのデータからオートスケールを簡単に実現できるよう、名前が指定したprefixのサーバ群のCPU使用率を取得し、コア数でCPU_TIMEを割り、最大・最小・平均のCPU使用率を出力するコマンドを新たに作りました。
実行例すると以下のように表示されます。さくらのクラウドのAPIを呼び出すためのTOKENなどは --env-from で指定したファイルから読み出せるようにしてあります。autoscalerの設定時に /etc/autoscaler/core.config にTOKENを書いているのでそれを利用します。
$ /usr/local/bin/sacloud-cpu-usage --env-from /etc/autoscaler/core.config  --zone tk1b --prefix hscale-group --time 2
2021/09/24 17:11:15 hscale-group-001 cores:1 cpu:0.036667 time:2021-09-24 17:00:00 +0900 JST
2021/09/24 17:11:15 hscale-group-001 cores:1 cpu:0.033333 time:2021-09-24 17:05:00 +0900 JST
2021/09/24 17:11:15 hscale-group-001 avg:3.500000
2021/09/24 17:11:15 hscale-group-002 cores:1 cpu:0.033333 time:2021-09-24 17:00:00 +0900 JST
2021/09/24 17:11:15 hscale-group-002 cores:1 cpu:0.033333 time:2021-09-24 17:05:00 +0900 JST
2021/09/24 17:11:15 hscale-group-002 avg:3.333333
{"75pt":3.5000000000000004,"90pt":3.5000000000000004,"95pt":3.5000000000000004,"99pt":3.5000000000000004,\
"avg":3.4166666666500003,"max":3.5000000000000004,"min":3.3333333333,"servers":[{"avg":3.5000000000000004,\
"cores":1,"monitors":[{"cpu_time":0.036666666667,"time":"2021-09-24 17:00:00 +0900 JST"},{"cpu_time":0.033333333333,\
"time":"2021-09-24 17:05:00 +0900 JST"}],"name":"hscale-group-001"},{"avg":3.3333333333,"cores":1,"monitors":\
[{"cpu_time":0.033333333333"time":"2021-09-24 17:00:00 +0900 JST"},{"cpu_time":0.033333333333,"time":\
"2021-09-24 17:05:00 +0900 JST"}],"name":"hscale-group-002"}]}
標準の出力はJSON形式でされますが、—query オプションで jq のシンタックスで表示するデータを絞ることができます。
$ /usr/local/bin/sacloud-cpu-usage --env-from /etc/autoscaler/core.config  --zone tk1b --prefix hscale-group --time 1 --query '.avg|round'
2021/09/24 17:12:52 hscale-group-001 cores:1 cpu:0.033333 time:2021-09-24 17:10:00 +0900 JST
2021/09/24 17:12:52 hscale-group-001 avg:3.333333
2021/09/24 17:12:53 hscale-group-002 cores:1 cpu:0.033333 time:2021-09-24 17:10:00 +0900 JST
2021/09/24 17:12:53 hscale-group-002 avg:3.333333
3
testコマンドでの評価は、floatを扱えないので、jqの round 関数で四捨五入してます。このqueryの処理にはgojqを使ってます。ライブラリ的にも使えて最高便利です!
オートスケールのcronの設置から最初のサーバの起動
sacloud-cpu-usage を使ったshell scriptを書きます
#!/bin/bash
set -e

cpu_usage=$(/usr/local/bin/sacloud-cpu-usage --env-from /etc/autoscaler/core.config  --zone tk1b --prefix hscale-group --time 1 --query '.avg|round')

if [ $cpu_usage -gt 50 ]; then
    echo "Scale up"
    /usr/local/sbin/autoscaler inputs direct up --dest unix:/var/run/autoscaler/autoscaler.sock --resource-name hscale-group

elif [ $cpu_usage -lt 20 -a $cpu_usage -gt 1]; then
    echo "Scale down"
    /usr/local/sbin/autoscaler inputs direct down --dest unix:/var/run/autoscaler/autoscaler.sock --resource-name hscale-group
else
    echo "Keep"
    /usr/local/sbin/autoscaler inputs direct up --dest unix:/var/run/autoscaler/autoscaler.sock --desired-state-name smallest --resource-name hscale-group

fi
sacloud-cpu-usageとgojqのおかげですごく簡単になりました。
そしてcronで起動します。
SHELL=/bin/bash
*/2 * * * * bash /etc/autoscaler/autoscale.sh |& logger -t autoscale
コマンドの出力を syslogに送るため、|& logger をコマンドの後ろに付けています。SHELL にてbashを指定しているのは、autoscalerを実行しているサーバがubuntuなのでデフォルトシェルがdashとなり、そのままでは |& が利用できないからです。
初回起動時、サーバなければ、最後の else 句にあるコマンドからサーバが作られます。
Sep 27 09:20:30 bastion1 autoscaler[691521]: timestamp=2021-09-27T09:20:30+09:00 level=info message="autoscaler core started" address=/var/run/autoscale /autoscaler.sock

Sep 27 09:22:01 bastion1 autoscale: Keep
Sep 27 09:22:01 bastion1 autoscaler[691521]: timestamp=2021-09-27T09:22:01+09:00 level=info request=Up message="request received"
Sep 27 09:22:01 bastion1 autoscaler[691521]: timestamp=2021-09-27T09:22:01+09:00 level=info request=Up source=default resource=hscale-group status=JOB_ACCEPTED
Sep 27 09:22:01 bastion1 autoscaler[691521]: timestamp=2021-09-27T09:22:01+09:00 level=info request=Up source=default resource=hscale-group status=JOB_RUNNING
Sep 27 09:22:01 bastion1 autoscale: status: JOB_ACCEPTED, job-id: hscale-group
Sep 27 09:22:02 bastion1 autoscaler[691521]: timestamp=2021-09-27T09:22:02+09:00 level=info request=Up source=default resource=hscale-group type=ServerGroupInstance zone=tk1b id="(known after handle)" name=hscale-group-001 step=Handle handler=server-horizontal-scaler status=ACCEPTED
Sep 27 09:22:02 bastion1 autoscaler[691521]: timestamp=2021-09-27T09:22:02+09:00 level=info request=Up source=default resource=hscale-group type=ServerGroupInstance zone=tk1b id="(known after handle)" name=hscale-group-001 step=Handle handler=server-horizontal-scaler status=RUNNING
Sep 27 09:22:02 bastion1 autoscaler[691521]: timestamp=2021-09-27T09:22:02+09:00 level=info request=Up source=default resource=hscale-group type=ServerGroupInstance zone=tk1b id="(known after handle)" name=hscale-group-001 step=Handle handler=server-horizontal-scaler status=RUNNING log=creating...
Sep 27 09:22:04 bastion1 autoscaler[691521]: timestamp=2021-09-27T09:22:04+09:00 level=info request=Up source=default resource=hscale-group type=ServerGroupInstance zone=tk1b id="(known after handle)" name=hscale-group-001 step=Handle handler=server-horizontal-scaler status=RUNNING log="created: {ID:113301705264, Name:hscale-group-001}"
Sep 27 09:22:04 bastion1 autoscaler[691521]: timestamp=2021-09-27T09:22:04+09:00 level=info request=Up source=default resource=hscale-group type=ServerGroupInstance zone=tk1b id="(known after handle)" name=hscale-group-001 step=Handle handler=server-horizontal-scaler status=RUNNING log="creating disk[0]..."
Sep 27 09:23:12 bastion1 autoscaler[691521]: timestamp=2021-09-27T09:23:12+09:00 level=info request=Up source=default resource=hscale-group type=ServerGroupInstance zone=tk1b id="(known after handle)" name=hscale-group-001 step=Handle handler=server-horizontal-scaler status=RUNNING log="created disk[0]: {ID:113301705268, Name:hscale-group-001-disk001, ServerID:113301705264}"
Sep 27 09:23:12 bastion1 autoscaler[691521]: timestamp=2021-09-27T09:23:12+09:00 level=info request=Up source=default resource=hscale-group type=ServerGroupInstance zone=tk1b id="(known after handle)" name=hscale-group-001 step=Handle handler=server-horizontal-scaler status=RUNNING log=starting...
....
サーバが作られているところ

2台起動後、負荷がかかるまでは、elif [ $cpu_usage -lt 20 -a $cpu_usage -gt 1]; then の条件にマッチするためScale Downが実行されます。ただし、min_sizeが2台となっているため、これ以上サーバが削除されたりはしていません。
Sep 27 09:38:01 bastion1 autoscale: 2021/09/27 09:38:01 hscale-group-001 cores:1 cpu:0.030000 time:2021-09-27 09:35:00 +0900 JST
Sep 27 09:38:01 bastion1 autoscale: 2021/09/27 09:38:01 hscale-group-001 avg:3.000000
Sep 27 09:38:02 bastion1 autoscale: 2021/09/27 09:38:02 hscale-group-002 cores:1 cpu:0.033333 time:2021-09-27 09:35:00 +0900 JST
Sep 27 09:38:02 bastion1 autoscale: 2021/09/27 09:38:02 hscale-group-002 avg:3.333333
Sep 27 09:38:02 bastion1 autoscale: Scale down
Sep 27 09:38:02 bastion1 autoscaler[691521]: timestamp=2021-09-27T09:38:02+09:00 level=info request=Down message="request received"
Sep 27 09:38:02 bastion1 autoscaler[691521]: timestamp=2021-09-27T09:38:02+09:00 level=info request=Down source=default resource=hscale-group status=JOB_ACCEPTED
Sep 27 09:38:02 bastion1 autoscaler[691521]: timestamp=2021-09-27T09:38:02+09:00 level=info request=Down source=default resource=hscale-group status=JOB_RUNNING
Sep 27 09:38:02 bastion1 autoscale: status: JOB_ACCEPTED, job-id: hscale-group
Sep 27 09:38:03 bastion1 autoscaler[691521]: timestamp=2021-09-27T09:38:03+09:00 level=info request=Down source=default resource=hscale-group status=JOB_DONE
Sep 27 09:40:02 bastion1 autoscale: 2021/09/27 09:40:02 hscale-group-001 cores:1 cpu:0.030000 time:2021-09-27 09:35:00 +0900 JST
Sep 27 09:40:02 bastion1 autoscale: 2021/09/27 09:40:02 hscale-group-001 avg:3.000000
Sep 27 09:40:03 bastion1 autoscale: 2021/09/27 09:40:03 hscale-group-002 cores:1 cpu:0.033333 time:2021-09-27 09:35:00 +0900 JST
Sep 27 09:40:03 bastion1 autoscale: 2021/09/27 09:40:03 hscale-group-002 avg:3.333333
Sep 27 09:40:03 bastion1 autoscale: Scale down
Sep 27 09:40:03 bastion1 autoscaler[691521]: timestamp=2021-09-27T09:40:03+09:00 level=info request=Down message="request received"
Sep 27 09:40:03 bastion1 autoscaler[691521]: timestamp=2021-09-27T09:40:03+09:00 level=info request=Down source=default resource=hscale-group status=JOB_IGNORED message="job is in an unacceptable state"
Sep 27 09:40:03 bastion1 autoscale: status: JOB_DONE, job-id: hscale-group, message: job is in an unacceptable state
スケールアップの確認
別のサーバから ApacheBench でアクセス負荷をかけることで、オートスケールされるかを検証してみます。
ApacheBench の実行
$ watch "ab -k -H 'Accept-Encoding: deflate, gzip, br' -c 3 -t 600 http://tk-elb.kazeburo.work/sekai.html"
アクティビティグラフで負荷が上がってきているのが確認できます。
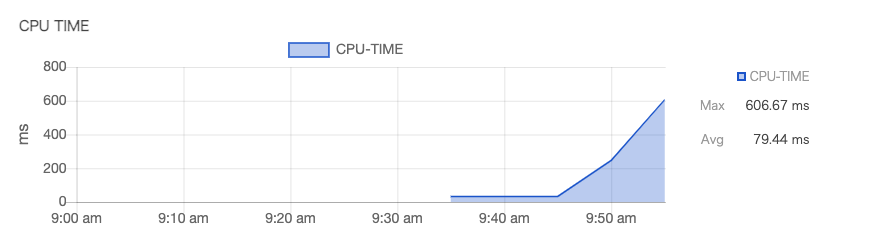
そしてcronからもCPU負荷が上がっているのが検知され、オートスケールが開始されます。
Sep 27 10:00:01 bastion1 autoscale: 2021/09/27 10:00:01 hscale-group-001 cores:1 cpu:0.606667 time:2021-09-27 09:55:00 +0900 JST
Sep 27 10:00:01 bastion1 autoscale: 2021/09/27 10:00:01 hscale-group-001 avg:60.666667
Sep 27 10:00:02 bastion1 autoscale: 2021/09/27 10:00:02 hscale-group-002 cores:1 cpu:0.606667 time:2021-09-27 09:55:00 +0900 JST
Sep 27 10:00:02 bastion1 autoscale: 2021/09/27 10:00:02 hscale-group-002 avg:60.666667
Sep 27 10:00:02 bastion1 autoscale: Scale up
Sep 27 10:00:02 bastion1 autoscaler[691943]: timestamp=2021-09-27T10:00:02+09:00 level=info request=Up message="request received"
Sep 27 10:00:02 bastion1 autoscaler[691943]: timestamp=2021-09-27T10:00:02+09:00 level=info request=Up source=default resource=hscale-group status=JOB_ACCEPTED
Sep 27 10:00:02 bastion1 autoscaler[691943]: timestamp=2021-09-27T10:00:02+09:00 level=info request=Up source=default resource=hscale-group status=JOB_RUNNING
Sep 27 10:00:02 bastion1 autoscale: status: JOB_ACCEPTED, job-id: hscale-group
Sep 27 10:00:04 bastion1 autoscaler[691943]: timestamp=2021-09-27T10:00:04+09:00 level=info request=Up source=default resource=hscale-group type=ServerGroupInstance zone=tk1b id="(known after handle)" name=hscale-group-003 step=Handle handler=server-horizontal-scaler status=ACCEPTED
Sep 27 10:00:04 bastion1 autoscaler[691943]: timestamp=2021-09-27T10:00:04+09:00 level=info request=Up source=default resource=hscale-group type=ServerGroupInstance zone=tk1b id="(known after handle)" name=hscale-group-003 step=Handle handler=server-horizontal-scaler status=RUNNING
Sep 27 10:00:04 bastion1 autoscaler[691943]: timestamp=2021-09-27T10:00:04+09:00 level=info request=Up source=default resource=hscale-group type=ServerGroupInstance zone=tk1b id="(known after handle)" name=hscale-group-003 step=Handle handler=server-horizontal-scaler status=RUNNING log=creating...
ApacheBenchを止めると、CPU負荷が納まりScale Downされます。
まとめ
sacloud/autoscaler とアクティビティグラフのデータを用いたオートスケールが実現できました。アクティビティグラフを利用することで、監視ツールなどを別途用意する必要がなくなり、オートスケールを楽に導入することができそうです。
