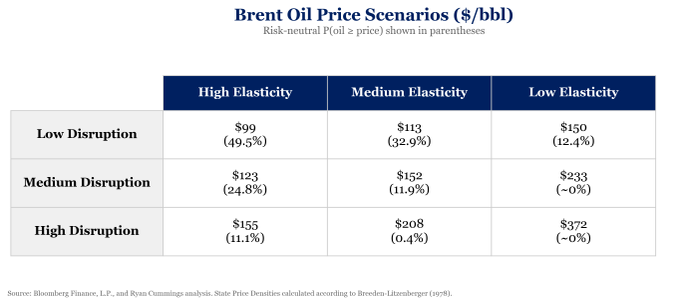
クルーグマンがブレント原油価格の9つのシナリオを提示している。
| 弾性値大 | 弾性値中 | 弾性値小 | |
|---|---|---|---|
| 混乱小 | 99 | 113 | 150 |
| 混乱中 | 123 | 152 | 233 |
| 混乱大 | 155 | 208 | 372 |
これは戦争が無い場合のブレント価格65ドルを基準としており、混乱小は8%、混乱中は12%、混乱大は16%の供給量の減少を仮定したとのことである。また需要に対する価格の弾性値は、0.2、0.15、0.1をそれぞれ仮定したとのことである。
Excelで検算してみると、「=EXP(LN(65)-LN(通常を1とした供給量)/弾性値) 」という数式でこのクルーグマンのマトリックスは再現できる(例:弾性値中、混乱中ならば「=EXP(LN(65)-LN(0.88)/0.15) 」)。
このクルーグマンの計算について、ジェイソン・ファーマンが以下のようにコメントしている。
On his terrific Substack @paulkrugman has an analysis of oil price scenarios.
The analysis is basic economics.
But the market thinks ~50% of the probability mass is below the lowest value in this table, ~20% is above the middle and ~0% is above the top.
Why the disconnect?
(grok翻訳を適宜修正)
彼の素晴らしいSubstack @paulkrugman で、原油価格のシナリオ分析が掲載されている。
この分析は基本的な経済学だ。
しかし市場の考えでは、この表の最低値以下の確率質量は約50%、中間値以上は約20%、最高値以上は約0%である。
なぜそうした乖離が生じているのか?
それにスタンフォード大経済政策研究所(Stanford Institute for Economic Policymaking (SIEPR))のRyan Cummingsが以下のように応じた。
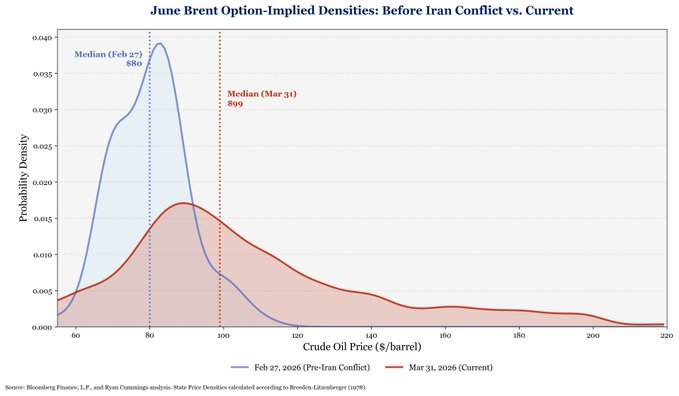
The median is low but it's masking substantial heterogeneity. In the exercise I've done below, I used options prices to show the implied distribution for June Brent using pre-war vs. current options prices. I'm mechanically underestimating the moments too btw.
(grok翻訳を適宜修正)
中央値は低いが、それはかなりの不均一性を隠してしまっている。以下の計算では、戦争前のオプション価格と現在のオプション価格を使用して、6月のブレント原油のインプライド分布を示した。ちなみに、ここではモーメントも機械的に過小評価している。
この分析にブランシャールが以下のように感服している。
Striking and convincing: The long right tail captures well the geopolitical uncertainty (how will Iran use its Hormuz leverage) and the uncertainty about the short run elasticity of demand (0.04, 0.1, 0.15).
(grok翻訳を適宜修正)
印象的で説得力のある分析だ:右側の長い裾野は、地政学的不確実性(イランがホルムズの影響力をどのように利用するのか)および需要の短期弾力性に関する不確実性(0.04、0.1、0.15)をよく捉えている。
一方、ファーマンは次のように反応している。
I did something similar but got somewhat different numbers, integrating visually (with the help of AI) you seem to have <10% chance the number is above Krugman's middle value.
(grok翻訳を適宜修正)
私も似たようなことをやったが、ちょっと違う数字が出た。(AIの助けを借りて)視覚的に積分すると、あなたの結果では価格がクルーグマンの中央値を超える確率は10%未満のようだ。
それに対しCummingsは、実際に確率を計算した結果を示した。
Here's P(oil>=price) from this. So roughly a little higher than 10%. But again, this is underestimating b/c the way it's approximating is overweighting low strikes and underweighting high strikes.
(grok翻訳を適宜修正)
これがこの結果の P(oil≥price)だ 。なので、10%より少し高いくらいだ。でもまたしても、これは過小評価している。なぜなら、この近似方法では、低い権利行使価格に過度に重みをつけ、高い権利行使価格に過度に軽い重みをつけているからだ。
一方、ライス大学ベーカー公共政策研究所(Rice University’s Baker Institute for Public Policy)のGabriel Collinsは次のようにコメントしている。
Good work @weakinstrument, does the implied price consider volumes? I imagine OTM vols are especially rich but if there’s low liquidity it may skew results
(grok翻訳を適宜修正)
@weakinstrument、素晴らしい分析だ。インプライド価格は出来高を考慮しているのか? アウト・オブ・ザ・マネーの出来高は特に多いと思うけど、流動性が低いところがあれば結果を歪めているかもしれないね。
これにCummingsは次のように返答している。
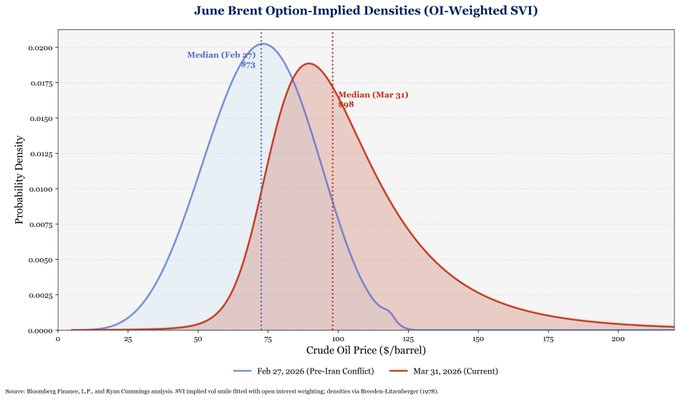
I'm not! Here's a version weighting by OI+using SVI. Qualitatively similiar, although both of these of course are rough approximations.
(grok翻訳を適宜修正)
していないね! こちらはOI*1で重み付けし、SVI*2を使用したバージョンだ。定性的には似ているが、もちろんこれらはどちらも大まかな近似値だ。
ちなみにクルーグマンはsubstackエントリを以下のように締め括っている。
After all, what would it take to get to my “high disruption” scenario? That’s what might happen if Iranian oil exports are cut off, say by a U.S. attack on Kharg Island, and if supply via pipelines is hindered by Iranian retaliation against other Gulf oil facilities as well as attacks by the Houthis on Red Sea shipping. That is not an outlandish possibility. It is, in fact, exactly what we should expect if the Trump administration follows through on what appear to be its current war plans.
And if oil really does go to $200 or more, it’s all too easy to envisage a full-blown global economic crisis, with an inflation surge and quite likely a recession.
Ever since this war began I’ve noticed a sharp divide in sentiment among experts. Finance and macroeconomics experts have been relatively sanguine about our ability to ride out this storm. But talk to or read energy experts — people who focus on the physical side of the oil crisis — and their hair is on fire.
I’m mostly a macroeconomist. But my hair is definitely starting to smolder.
(拙訳)
結局のところ、私の「混乱大」シナリオはどのようなことで生じるだろうか? イランの石油輸出が、例えばカーグ島への米国の攻撃によって途絶し、パイプライン経由の供給がイランの他の湾岸の石油施設への報復によって妨げられるとともに、フーシ派による紅海輸送への攻撃が行われれば、そうしたことが生じ得る。これは可能性として突飛なものではない。実際のところ、トランプ政権が、現在の同政権の戦争プランと思われるものを継続するならば、我々はまさにそうしたことを予期すべきである。
そして原油価格が実際に200ドル以上に達すれば、本格的な世界経済危機が訪れることは容易に想像がつく。インフレは高騰し、景気後退に陥る可能性は極めて高い。
今回の戦争開始以来、専門家の意見が鋭く分かれたことに私は気づいた。金融とマクロ経済の専門家は、この嵐を乗り切る我々の能力について相対的に楽天的である。しかし、石油危機の物理的な側面に力点を置くエネルギーの専門家と話したり彼らの書いたものを読んだりすると、彼らは髪に火が付いている。
私は概ねマクロ経済学者である。しかし明らかに私の髪は焦げ始めている。
*1:グラフのタイトルからするとOptionーImplied Densityのことかと思われる。
*2:おそらくStochastic Volatility Inspired。cf. 関連論文、What is SVI? A model quants love for options trading | Mehul Mehta posted on the topic | LinkedIn、SVIによる株価スマイル補間の基礎 | Quant College。
